
Introduction
Dashboards can be thought of a bit like your phone’s home screen, but for Recruitment & Hiring. They are your Pipeline and Command centre that shows everything that’s happening with you Jobs, Candidates, Clients, Placements and more. They can show your Tasks and Activities allowing you to quickly and easily check what needs your attention.
itris Dashboards are highly customisable to your individual, user roles, team and/or business needs and they can be shared amongst users.
You can have multiple Dashboards, even set your default Dashboard as your start up Screen (via My Settings).
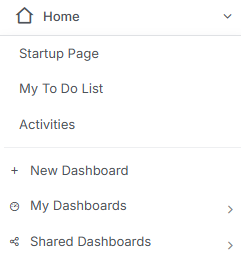
Dashboards are accessed via the Menu Bar.
- My Dashboards
- Shared Dashboards
Dashboards can be comprised of: Widgets, Reports & (saved) Record Views.
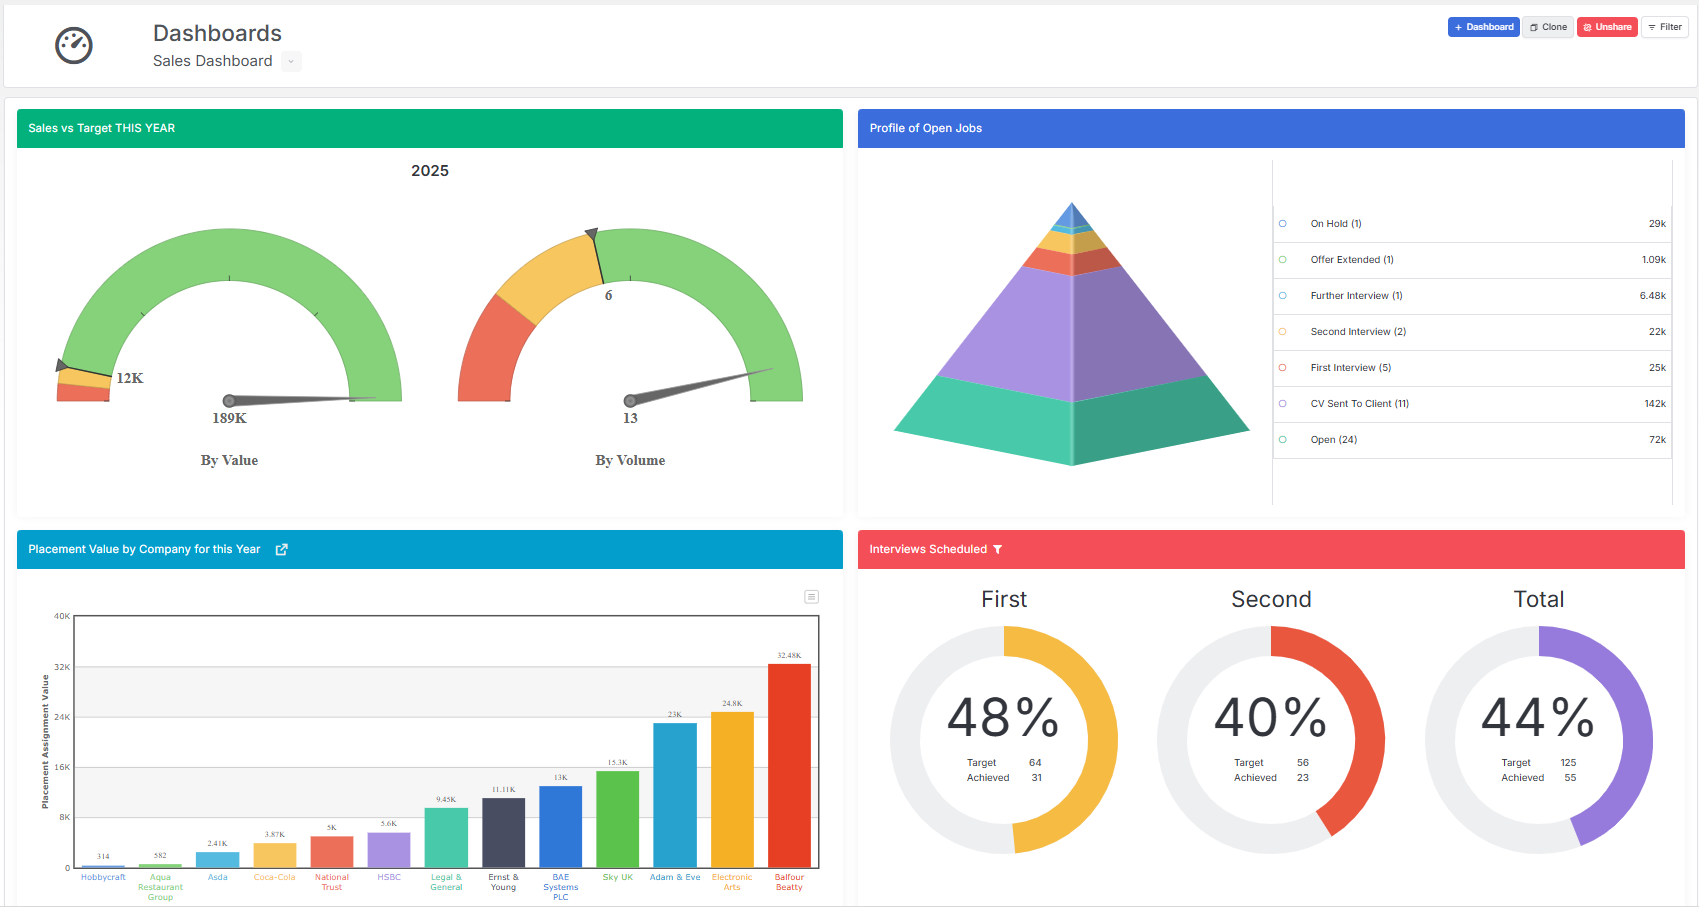
Creating a Dashboard
There are three routes to creating a New Dashboard.
- Menu Bar > New
- From within a Dashboard > New
- From within a Dashboard > Clone (this copies the existing Dashboard you are currently viewing)
When creating a New Dashboard the Dashboard Panel will open to the right.
From here you can add multiple components to the Dashboard from:
- Widgets
- Reports
- Views
Each Dashboard you create is highly configurable, components in one Dashboard can of multiple types (e.g. you can have Widgets, Reports & Views all in one Dashboard). Once a component is added you can move them around to rearrange the order, you can edit the size of the component and change the banner colour.
Dashboard Widgets
There are a huge array of predefined Widgets that can be included in your Dashboards such as Progress against KPI’s & Targets, Activities logged, Recruitment workflow stages, and are Grouped together in the Dashboard Panel to help you find relevant ones.
Dashboard Widgets update in real time and where targets have been set against a metric the widget will show both the Target and Achieved value.
A Widget is added by clicking the Plus icon next to it, it will be added to the top right of the Dashboard screen.
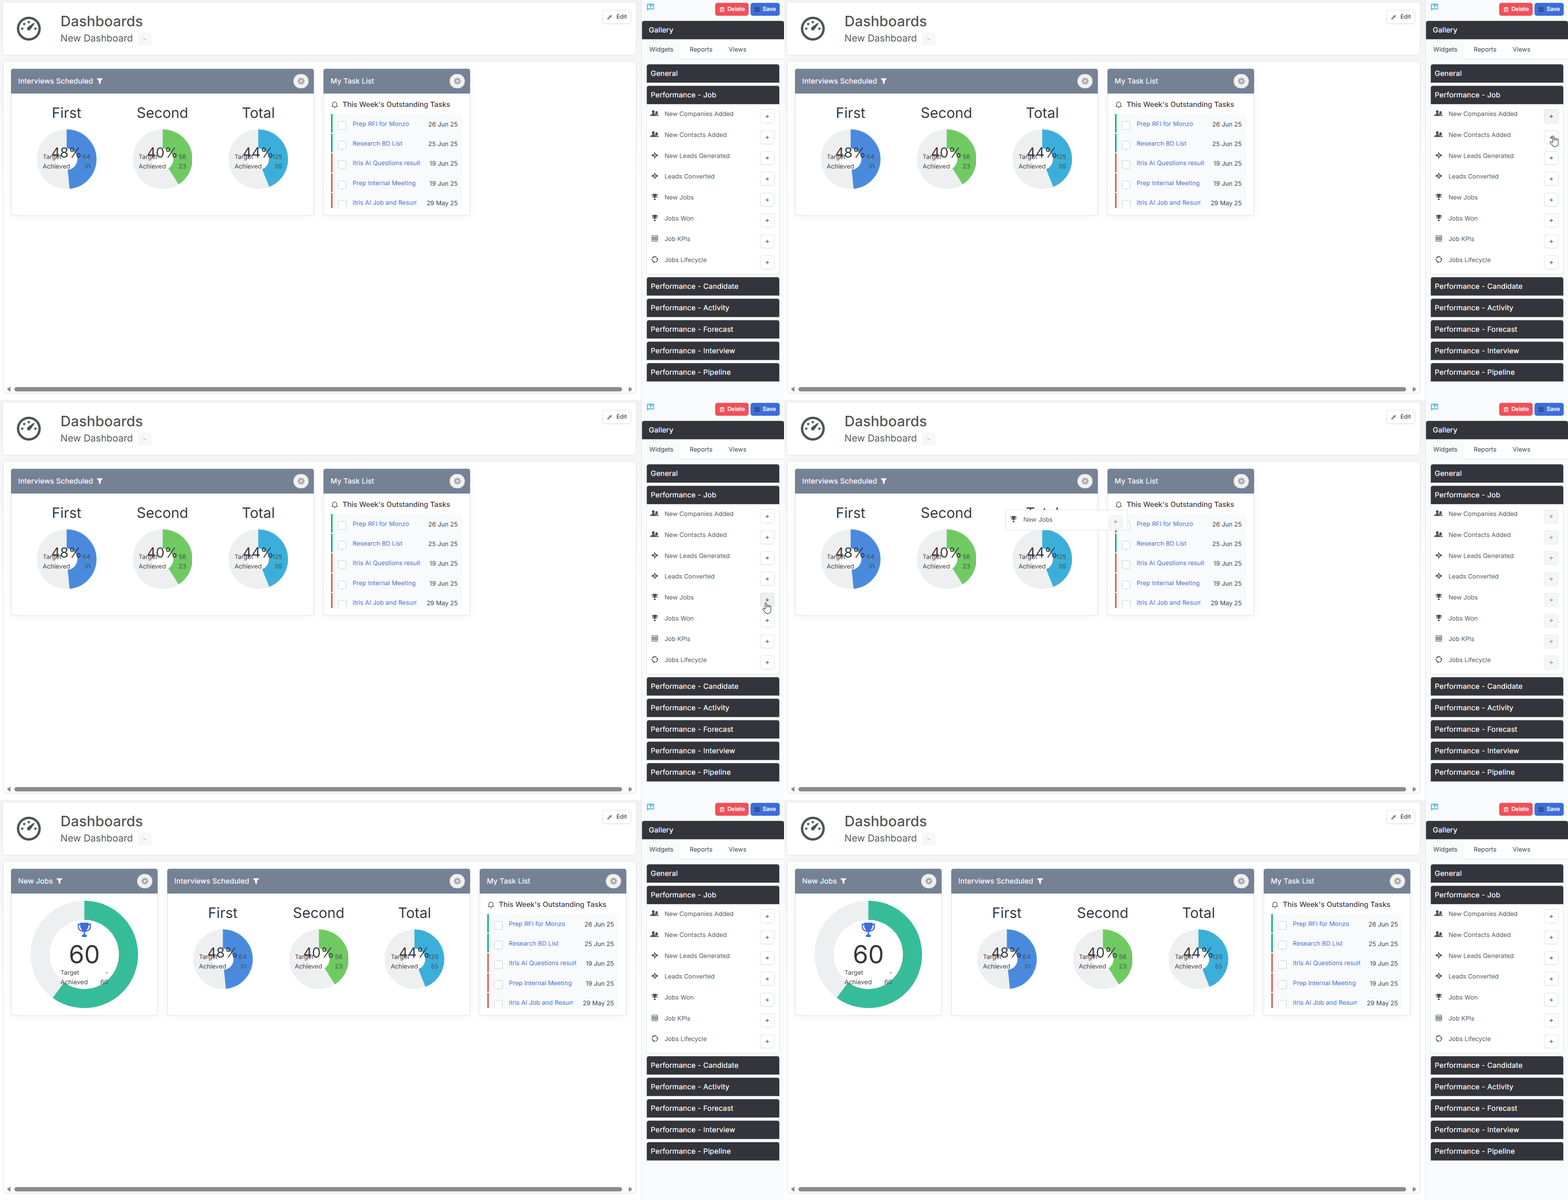
If there is not a Widget that matches you requirements, you will most likely find this can be achieved by creating Reports or Views to add to your Dashboard.
See below for how Filtering on Widgets works.
Dashboard Reports
The reports visible in the Reports tab of the Dashboard Panel will be those of which you are the Owner or where they have been shared with you.
The Groups under which they are organised will be the same groups you see in the Reporting area. This components will have the layout, parameters & filters etc applied them at the Report level (not via the Dashboard).
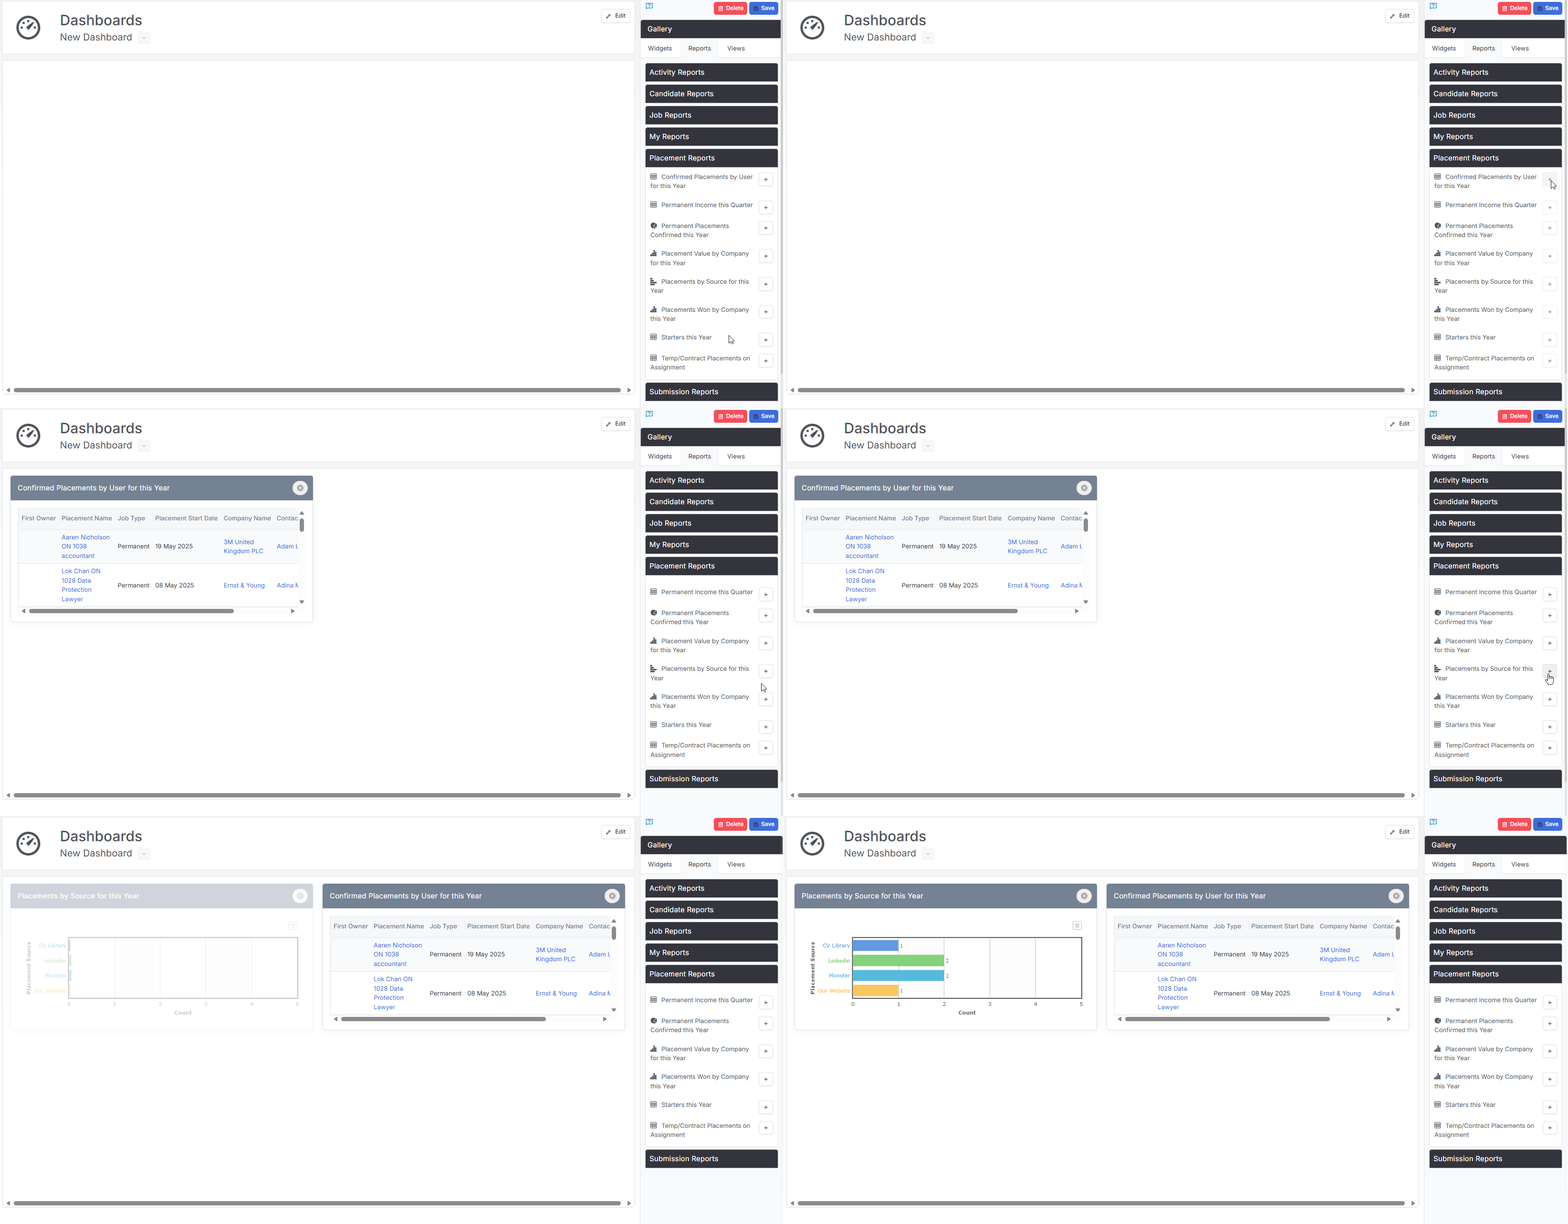
A Report is added by clicking the Plus icon next to it, it will be added to the top right of the Dashboard screen.
Dashboard Views
Dashboard Views are a saved Record Views where you are the owner of that view or it has been shared with you.
These are Grouped a per the record types where you have saved views, and will have parameters & filters etc applied them at the Saved View level.
A View is added by clicking the Plus icon next to it, it will be added to the top right of the Dashboard screen.
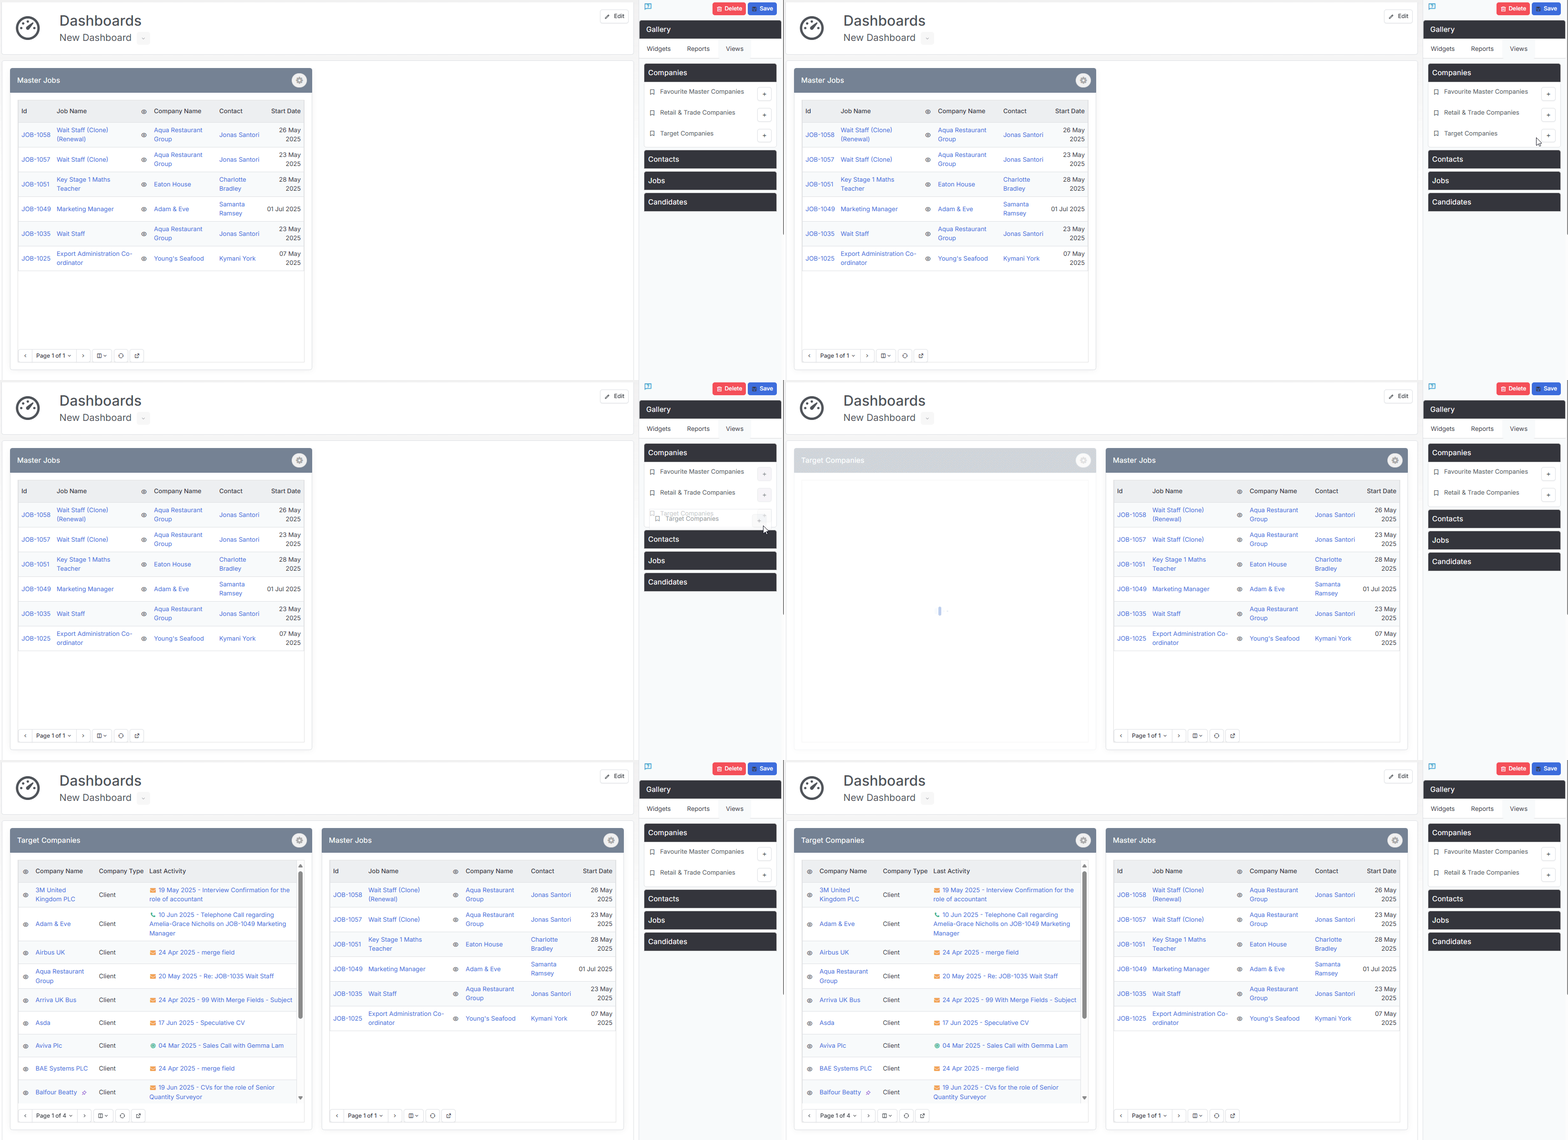
With Views, at the foot of the component you have options to scroll through the pages, add additional columns to the component in Dashboard view, refresh and show the View in the Record Views area.
Saving & Sharing
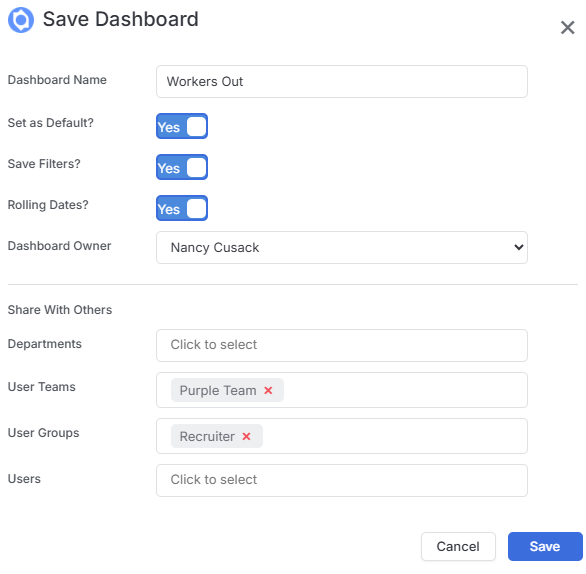
When Saving a Dashboard you have the following options:
- Dashboard Name
- Set as Default - this means if using a Dashboard as your start up page the one set as default will be used
- Save Filters - see below
- Rolling dates - auto go to next month/week etc depending on what components you have set
- Ownership - for example you may be creating the Dashboard for somebody else, or making a clone (see below) of your Dashboard for somebody.
- Share with other users
Customising a Dashboard
The Configuration options below will be accessible whilst in creation/edit mode, however, if you wish to make changes whilst viewing you may have to Unlock the Dashboard first.

Configuration
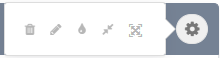
In the top right corner of each component is a configuration icon where you can:
- Remove from the Dashboard
- Change the name
- Change Colour of the Header Banner
- View/Collapse full screen - this is particularly useful with Report Grid & KPI widgets
- Resize the component
Moving Components
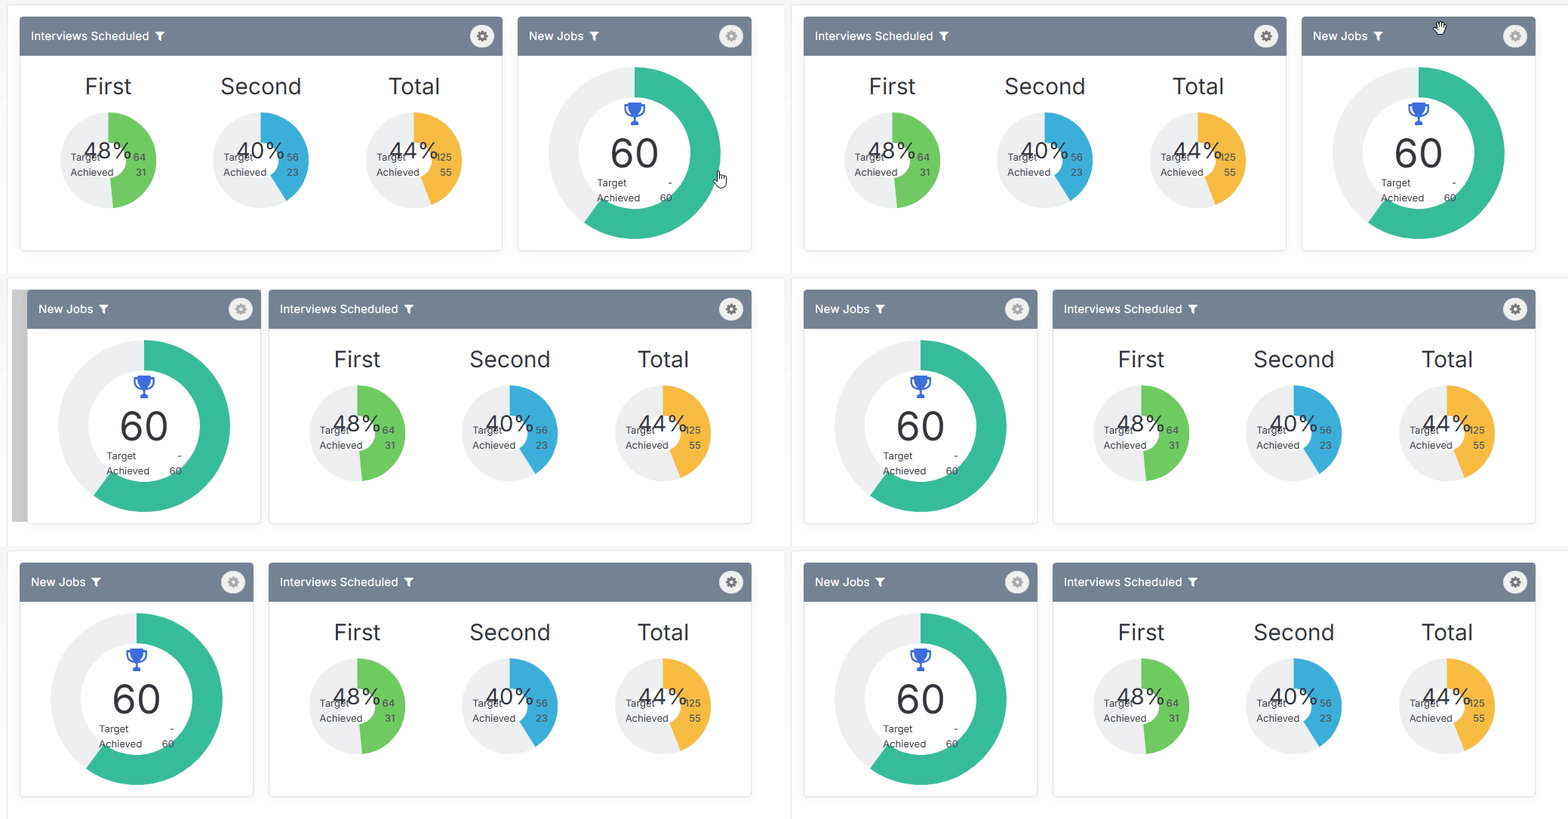
Components can be dragged and dropped into different positions so that you get the layout required.
Filtering
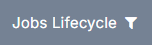
The Filter is located in the top right when viewing a Dashboard.
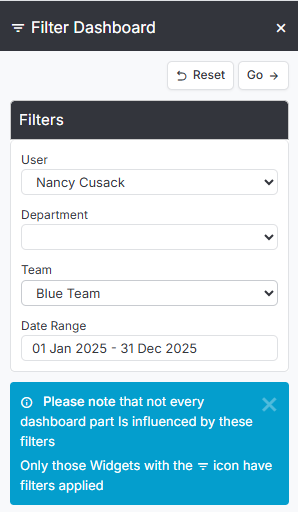
Only Widgets with the filter icon will be affected by the parameters set in the Filter.
Via the filter you can change:
- Change the User (assuming you have the permissions to do so)
- Departments
- Teams
Dates (e.g. Today, Tomorrow, Last x Days, This/Last Week/Month, This Year or Custom).
Editing
Edit is located in the top right when viewing a Dashboard.
This opens the panel to add in additional components, you will also be able to configure the layout etc in this mode too.
If you wish to Share the Dashboard with additional users you will need to go into Edit mode and Re-Save in order to do so.
Cloning
Clone is located in the top right when viewing a Dashboard.
Cloning is a great way to share personalised Dashboards. When Saving the Dashboard you can then change the Owner to that person so that they have full control, e.g. to change the user it is applied to.